
Maintaining physical and mental health is an important part of one's financial life, especially as one ages. The health status of an individual – and even the community at large – can impact the prices of health care, health insurance, life insurance, long-term care insurance and other related expenses. It can also undercut the best-laid financial goals and impact overall quality of life for an individual and their family.
With this in mind, SmartAsset ranked 100 of the largest U.S. cities to find the healthiest places based on 10 metrics: obesity, physical activity levels, smoking, excessive drinking, rate of physically unwell days, rate of mentally unwell days, air pollution, sleep sufficiency, diabetes, and drug overdose deaths.
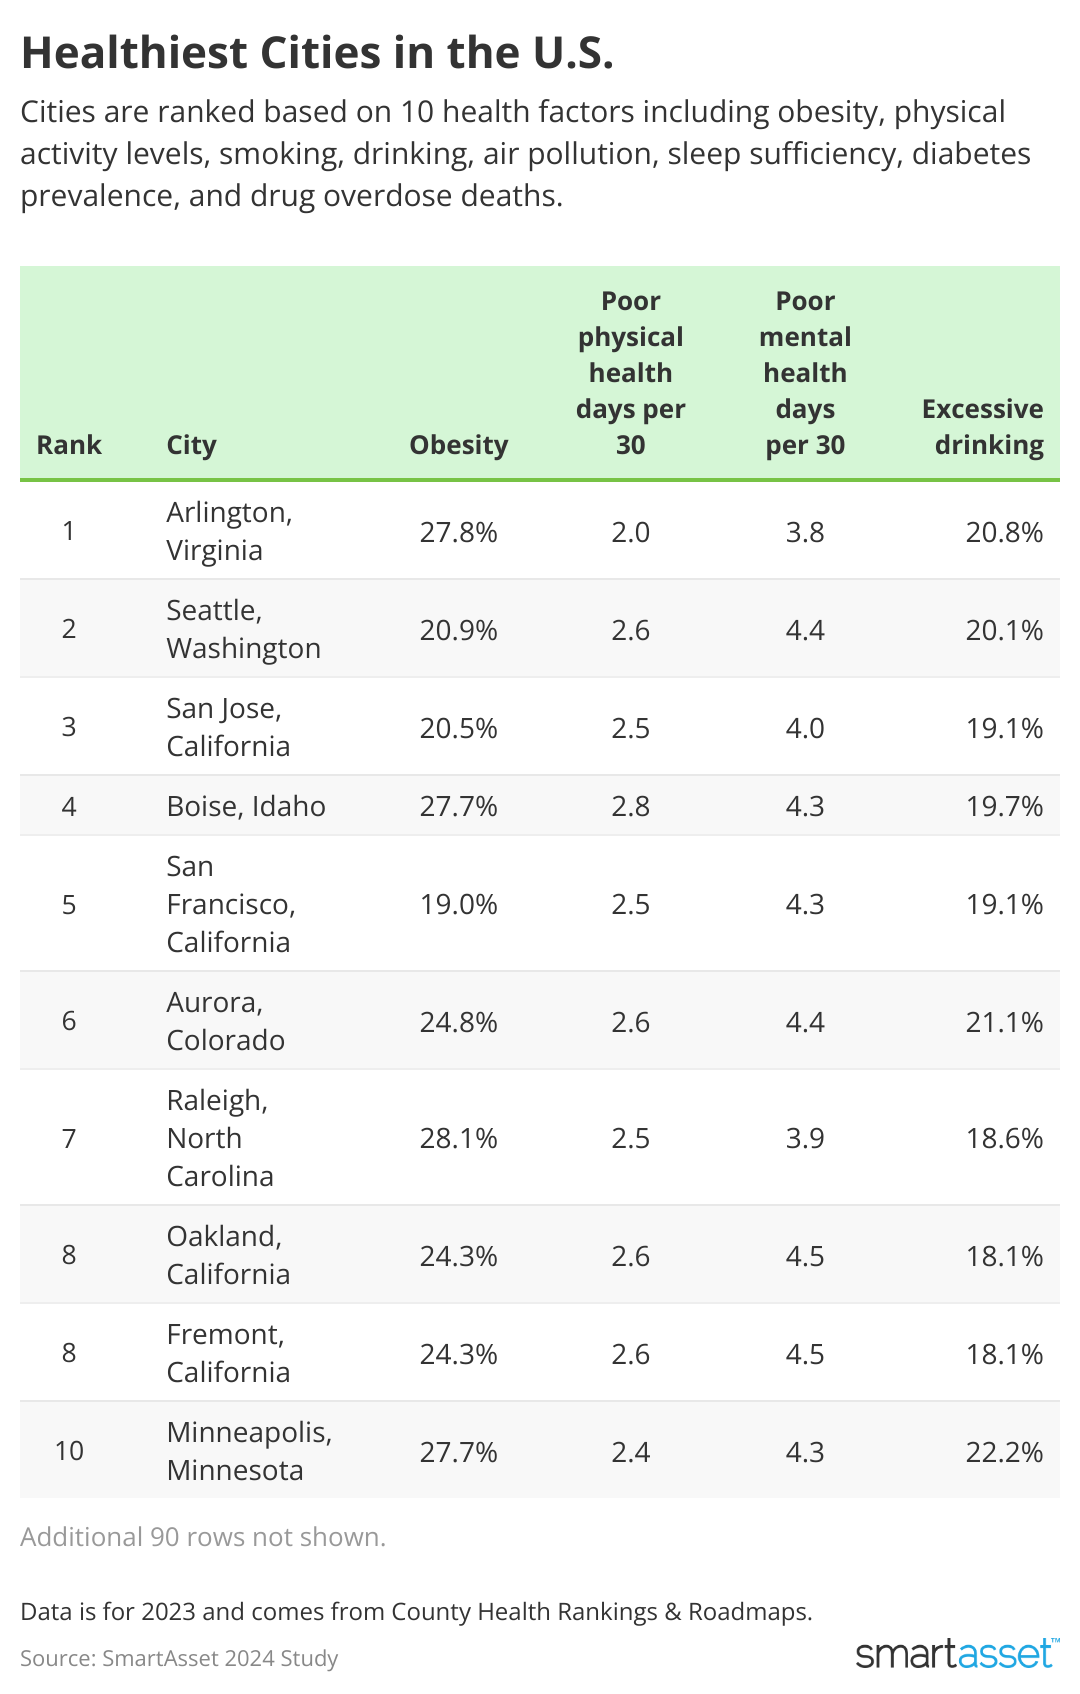
1. Arlington, Virginia
Physically unhealthy days per 30 days: 2.0
Mentally unhealthy days per 30 days: 3.8
Current smokers: 9.0%
Adult obesity: 27.8%
Adults with no leisure-time physical activity: 14.4%
Adults reporting binge or heavy drinking: 20.8%
Average daily density of fine particulate matter in micrograms per cubic meter of air (PM2.5): 8
Adults aged 20 and above with diagnosed diabetes: 8.0%
Drug overdose deaths per 100,000 population: 9.0
Adults who report fewer than 7 hours of sleep on average: 28.4%
2. Seattle, Washington
Physically unhealthy days per 30 days: 2.6
Mentally unhealthy days per 30 days: 4.4
Current smokers: 9.5%
Adult obesity: 20.9%
Adults with no leisure-time physical activity: 13.9%
Adults reporting binge or heavy drinking: 20.1%
Average daily density of fine particulate matter in micrograms per cubic meter of air (PM2.5): 8.3
Adults aged 20 and above with diagnosed diabetes: 7.0%
Drug overdose deaths per 100,000 population: 18.9
Adults who report fewer than 7 hours of sleep on average: 27.4%
3. San Jose, California
Physically unhealthy days per 30 days: 2.5
Mentally unhealthy days per 30 days: 4.0
Current smokers: 8.4%
Adult obesity: 20.5%
Adults with no leisure-time physical activity: 18.5%
Adults reporting binge or heavy drinking: 19.1%
Average daily density of fine particulate matter in micrograms per cubic meter of air (PM2.5): 9.2
Adults aged 20 and above with diagnosed diabetes: 8.6%
Drug overdose deaths per 100,000 population: 12.0
Adults who report fewer than 7 hours of sleep on average: 28.7%
4. Boise, Idaho
Physically unhealthy days per 30 days: 2.8
Mentally unhealthy days per 30 days: 4.3
Current smokers: 13.3%
Adult obesity: 27.7%
Adults with no leisure-time physical activity: 17.2%
Adults reporting binge or heavy drinking: 19.7%
Average daily density of fine particulate matter in micrograms per cubic meter of air (PM2.5): 5.4
Adults aged 20 and above with diagnosed diabetes: 7.5%
Drug overdose deaths per 100,000 population: 16.7
Adults who report fewer than 7 hours of sleep on average: 28.5%
5. San Francisco, California
Physically unhealthy days per 30 days: 2.5
Mentally unhealthy days per 30 days: 4.3
Current smokers: 9.0%
Adult obesity: 19.0%
Adults with no leisure-time physical activity: 16.9%
Adults reporting binge or heavy drinking: 19.1%
Average daily density of fine particulate matter in micrograms per cubic meter of air (PM2.5): 7.7
Adults aged 20 and above with diagnosed diabetes: 8.8%
Drug overdose deaths per 100,000 population: 45.1
Adults who report fewer than 7 hours of sleep on average: 29.4%
6. Aurora, Colorado
Physically unhealthy days per 30 days: 2.6
Mentally unhealthy days per 30 days: 4.4
Current smokers: 13.1%
Adult obesity: 24.8%
Adults with no leisure-time physical activity: 18.3%
Adults reporting binge or heavy drinking: 21.1%
Average daily density of fine particulate matter in micrograms per cubic meter of air (PM2.5): 6
Adults aged 20 and above with diagnosed diabetes: 7.6%
Drug overdose deaths per 100,000 population: 18.1
Adults who report fewer than 7 hours of sleep on average: 29.2%
7. Raleigh, North Carolina
Physically unhealthy days per 30 days: 2.5
Mentally unhealthy days per 30 days: 3.9
Current smokers: 11.5%
Adult obesity: 28.1%
Adults with no leisure-time physical activity: 16.2%
Adults reporting binge or heavy drinking: 18.6%
Average daily density of fine particulate matter in micrograms per cubic meter of air (PM2.5): 10.2
Adults aged 20 and above with diagnosed diabetes: 8.6%
Drug overdose deaths per 100,000 population: 13.5
Adults who report fewer than 7 hours of sleep on average: 30.5%
8 (tie). Oakland, California
Physically unhealthy days per 30 days: 2.6
Mentally unhealthy days per 30 days: 4.5
Current smokers: 9.9%
Adult obesity: 24.3%
Adults with no leisure-time physical activity: 17.9%
Adults reporting binge or heavy drinking: 18.1%
Average daily density of fine particulate matter in micrograms per cubic meter of air (PM2.5): 9.4
Adults aged 20 and above with diagnosed diabetes: 9.1%
Drug overdose deaths per 100,000 population: 15.2
Adults who report fewer than 7 hours of sleep on average: 29.9%
8. (tie) Fremont, California
Physically unhealthy days per 30 days: 2.6
Mentally unhealthy days per 30 days: 4.5
Current smokers: 9.9%
Adult obesity: 24.3%
Adults with no leisure-time physical activity: 17.9%
Adults reporting binge or heavy drinking: 18.1%
Average daily density of fine particulate matter in micrograms per cubic meter of air (PM2.5): 9.4
Adults aged 20 and above with diagnosed diabetes: 9.1%
Drug overdose deaths per 100,000 population: 15.2
Adults who report fewer than 7 hours of sleep on average: 29.9%
10. Minneapolis, Minnesota
Physically unhealthy days per 30 days: 2.4
Mentally unhealthy days per 30 days: 4.3
Current smokers: 13.3%
Adult obesity: 27.7%
Adults with no leisure-time physical activity: 16.4%
Adults reporting binge or heavy drinking: 22.2%
Average daily density of fine particulate matter in micrograms per cubic meter of air (PM2.5): 8.3
Adults aged 20 and above with diagnosed diabetes: 7.5%
Drug overdose deaths per 100,000 population: 19.8
Adults who report fewer than 7 hours of sleep on average: 25.4%
Data is for 2023 and comes from County Health Rankings & Roadmaps. Data was examined for the largest 100 cities for which data was available. Cities are mapped to county-level. Variables are age-adjusted and self-reported, and include:
This story was produced by SmartAsset and reviewed and distributed by Stacker Media.